

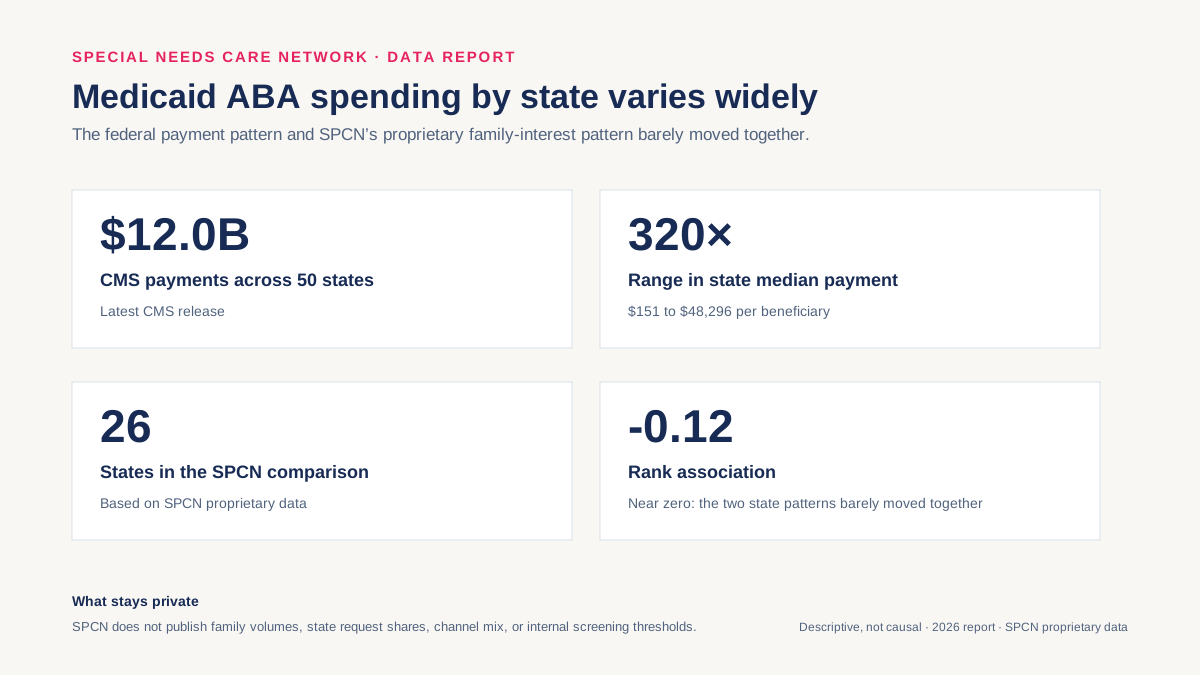
Total reported across the 50 states in the latest CMS release.
Special Needs Care Network Data Report
Medicaid ABA Spending by State: What the 2026 Report Shows
Medicaid ABA spending by state varies widely. The latest CMS release reported $12B in payments across 50 states, while median payment per beneficiary ranged from $151 to $48,296. An aggregate comparison based on SPCN proprietary data found that higher payment levels did not consistently line up with the pattern of families looking for ABA support.
Analysis by: Special Needs Care Network Federal data: CMS T-MSIS ABA heat map, published 2026 SPCN data: proprietary family-interest data Updated: August 30, 2026
Highest-to-lowest median payment per beneficiary.
States included after SPCN’s internal quality and privacy checks.
Near zero: the two state patterns barely moved together.
State comparison
Florida reports the highest median payment per beneficiary
Each state is shaded by its CMS-reported median Medicaid ABA payment per beneficiary for calendar year 2025. Darker means a higher median payment, not better access or quality.
01 The national finding
What Medicaid ABA spending by state shows and does not show
Across 26 states that passed SPCN’s internal quality and privacy checks, the rank association between CMS median payment per beneficiary and SPCN’s family-interest pattern was -0.12. In regular language: the two state patterns barely moved together.
Florida to West Virginia
Florida had the highest median amount paid per beneficiary at $48,296. West Virginia had the lowest at $151.
The near-zero pattern persisted
The result stayed near zero when SPCN repeated the analysis using stricter internal quality checks. SPCN keeps the underlying state counts and acquisition details private so this report does not expose commercially sensitive demand data.
Spending is not the same as availability
Payment totals can reflect population, state benefit design, service intensity, billing definitions, and managed-care arrangements. Family requests can reflect need, awareness, search visibility, and SPCN’s own reach. Neither measure provides wait times or open capacity.
02 Federal payment context
Five states accounted for the largest CMS payment totals
Total payment is not population-adjusted. It gives scale, while the median-per-beneficiary measure is the cleaner comparison used in the scatter plot.
03 State table
Medicaid ABA spending by state
The public table contains the official CMS measures only. SPCN’s state-level family data is used for the aggregate comparison but is not published.
50 states
| State | CMS providers | CMS total paid | Median / provider | Median / beneficiary | Payment rank |
|---|---|---|---|---|---|
| AlabamaAL | 697 | $51.9M | $24,923 | $12,293 | #35 |
| AlaskaAK | 147 | $5.5M | $9,572 | $5,933 | #43 |
| ArizonaAZ | 937 | $230.7M | $136,772 | $18,292 | #14 |
| ArkansasAR | 1,509 | $62.5M | $13,628 | $17,955 | #31 |
| CaliforniaCA | 23,235 | $2B | $12,920 | $791 | #2 |
| ColoradoCO | 1,385 | $329.6M | $130,207 | $22,106 | #10 |
| ConnecticutCT | 2,063 | $111.5M | $11,520 | $780 | #24 |
| DelawareDE | 60 | $7.4M | $20,098 | $1,837 | #41 |
| FloridaFL | 44,917 | $2.6B | $44,621 | $48,296 | #1 |
| GeorgiaGA | 4,440 | $598.6M | $63,893 | $19,375 | #4 |
| HawaiiHI | 305 | $25.5M | $41,301 | $19,047 | #37 |
| IdahoID | 49 | $363.2K | $1,722 | $946 | #50 |
| IllinoisIL | 44 | $2.3M | $13,671 | $4,074 | #47 |
| IndianaIN | 11,027 | $503.5M | $16,343 | $34,841 | #6 |
| IowaIA | 439 | $57.9M | $37,600 | $14,919 | #33 |
| KansasKS | 1,510 | $42.9M | $12,691 | $15,081 | #36 |
| KentuckyKY | 495 | $77.3M | $68,047 | $8,457 | #30 |
| LouisianaLA | 2,349 | $150.9M | $38,862 | $17,923 | #19 |
| MaineME | 264 | $163.6M | $167,096 | $22,674 | #18 |
| MarylandMD | 7,233 | $218.3M | $14,876 | $27,216 | #15 |
| MassachusettsMA | 2,022 | $316.7M | $61,615 | $17,549 | #11 |
| MichiganMI | 188 | $312M | $313,451 | $22,611 | #12 |
| MinnesotaMN | 10,646 | $381.1M | $25,542 | $32,909 | #7 |
| MississippiMS | 96 | $8.8M | $35,156 | $5,078 | #40 |
| MissouriMO | 730 | $130.9M | $81,669 | $10,509 | #20 |
| MontanaMT | 49 | $4.2M | $51,024 | $8,764 | #44 |
| NebraskaNE | 2,697 | $86.4M | $11,991 | $25,415 | #28 |
| NevadaNV | 2,426 | $90.2M | $18,552 | $20,237 | #27 |
| New HampshireNH | 263 | $20.4M | $16,764 | $9,905 | #38 |
| New JerseyNJ | 1,488 | $269.1M | $45,633 | $260 | #13 |
| New MexicoNM | 2,368 | $122.8M | $27,267 | $9,567 | #21 |
| New YorkNY | 1,552 | $378.7M | $97,806 | $13,276 | #8 |
| North CarolinaNC | 1,633 | $695.9M | $10,446 | $28,417 | #3 |
| North DakotaND | 218 | $3.5M | $7,081 | $6,855 | #45 |
| OhioOH | 702 | $99.9M | $63,079 | $11,883 | #26 |
| OklahomaOK | 3,117 | $115.8M | $20,114 | $24,727 | #22 |
| OregonOR | 441 | $59M | $41,490 | $13,770 | #32 |
| PennsylvaniaPA | 267 | $587.5M | $956,650 | $10,952 | #5 |
| Rhode IslandRI | 18 | $626.8K | $7,162 | $1,072 | #49 |
| South CarolinaSC | 621 | $78.6M | $61,277 | $8,175 | #29 |
| South DakotaSD | 51 | $6.7M | $79,639 | $10,846 | #42 |
| TennesseeTN | 1,016 | $189.1M | $139,489 | $12,366 | #17 |
| TexasTX | 1,391 | $193.2M | $51,223 | $15,043 | #16 |
| UtahUT | 104 | $104M | $229,206 | $20,423 | #25 |
| VermontVT | 39 | $659.3K | $1,361 | $546 | #48 |
| VirginiaVA | 1,979 | $332.2M | $55,850 | $19,313 | #9 |
| WashingtonWA | 1,529 | $54.3M | $7,101 | $9,871 | #34 |
| West VirginiaWV | 260 | $9.3M | $4,010 | $151 | #39 |
| WisconsinWI | 5,929 | $111.5M | $8,730 | $11,176 | #23 |
| WyomingWY | 61 | $2.5M | $5,463 | $6,409 | #46 |
04 Methodology
Two datasets, kept in their proper lanes
National trend context
CMS’s August 2026 ABA Toolkit reports that, from 2021 through 2025, the number of children with an ASD diagnosis receiving ABA rose 189%, while ABA spending among children with ASD rose 421%. These are national Medicaid and CHIP trends based on T-MSIS claims and associated eligibility data across 50 states, D.C., Puerto Rico, the U.S. Virgin Islands, and Guam. They do not show that a particular family can obtain care, that a provider has an opening, or that any state’s payments were improper.
CMS payment layer
CMS’s August 2026 Applied Behavior Analysis heat map reports calendar-year 2025 state provider counts, total paid, median payment per provider, and median payment per beneficiary. It uses Transformed Medicaid Statistical Information System data and includes fee-for-service and managed-care utilization. CMS notes that state definitions and limits differ and that geographic variation alone does not indicate fraud, waste, abuse, or improper billing.
How SPCN compared family interest
SPCN compared the CMS payment pattern with a 90-day pattern of families looking for ABA support through its website. Related requests were counted once, and only states that passed internal sample-quality checks were included.
Privacy and commercial safeguards
No names, email addresses, phone numbers, messages, or individual records were used in the public report. SPCN also withholds family volumes, state request shares, marketing-channel details, and the exact screening thresholds. Those details are not needed to understand or cite the aggregate finding.
Association measure
The report uses Spearman’s rank coefficient to ask a simple question: did states with higher CMS median payments per beneficiary also tend to rank higher in SPCN’s family-interest pattern? The answer was barely. The coefficient was -0.12, where a value near zero means the rankings did not move together in a consistent direction. This does not test cause and effect.
05 Common questions
Questions about Medicaid ABA spending by state
Which state had the highest total in the CMS Medicaid ABA data?
Florida had the highest CMS-reported total at $2,639,198,783. Total spending is not adjusted for state population.
Are these ABA Medicaid reimbursement rates by state?
No. These are CMS-reported payment measures, not state fee schedules or CPT-code reimbursement rates. A reimbursement-rate comparison requires the current fee schedule for each state and billing code.
Does higher Medicaid ABA spending mean families have better access?
No. Spending does not show provider openings, wait times, Medicaid acceptance, service fit, treatment quality, or outcomes.
06 Download and cite
Built for reporters, researchers, and advocates
You may reuse the chart and CMS state table with attribution to Special Needs Care Network. Federal definitions and caveats must travel with the numbers.
Download the data
Fifty state rows containing the public CMS payment measures. SPCN family data is not included.
Download CSVReuse the chart
Source-ready vector artwork sized for articles, newsletters, and presentations.
Download SVGCopy the citation
Special Needs Care Network. “Medicaid ABA Spending by State: 2026 Report.” Updated August 30, 2026. CMS payment data with an aggregate comparison based on SPCN proprietary family-interest data. https://specialneedsusa.com/data/medicaid-aba-spending-by-state
Sources
- Centers for Medicare & Medicaid Services, Applied Behavior Analysis National Heat Map and State Statistics for CY 2025, published August 2026.
- Medicaid.gov, Autism Services, including the August 2026 ASD/ABA Data Book and State Medicaid & CHIP ABA Toolkit.
- Centers for Medicare & Medicaid Services, State Medicaid & CHIP ABA Toolkit, August 2026; source for the national 2021–2025 utilization and spending figures.
- Special Needs Care Network proprietary family-interest analysis, 90 days ending August 30, 2026. Public methodology and privacy limits are documented above.
Questions, interview requests, or requests for a state cut: admin@specialneedsusa.com.
Looking for support, not statistics?
Browse ABA therapy options near you
The directory can help you compare listed providers. Always confirm services, insurance participation, availability, and fit directly with the provider.
Explore the therapy directory