

Special Needs Care Network · Data & Reports
Autism classroom inclusion
by state
How much of the school day do students served under IDEA’s autism category spend in regular classrooms? A state-by-state comparison from the 2024–25 federal release.
 Reviewed by Eric Sampson, M.Ed (special education)
 Clinically reviewed by Meaghan Timko, MS, BCBA, LBA BACB certification #1-05-2608
of autism-category students spent 80% or more of the school day inside regular classes.
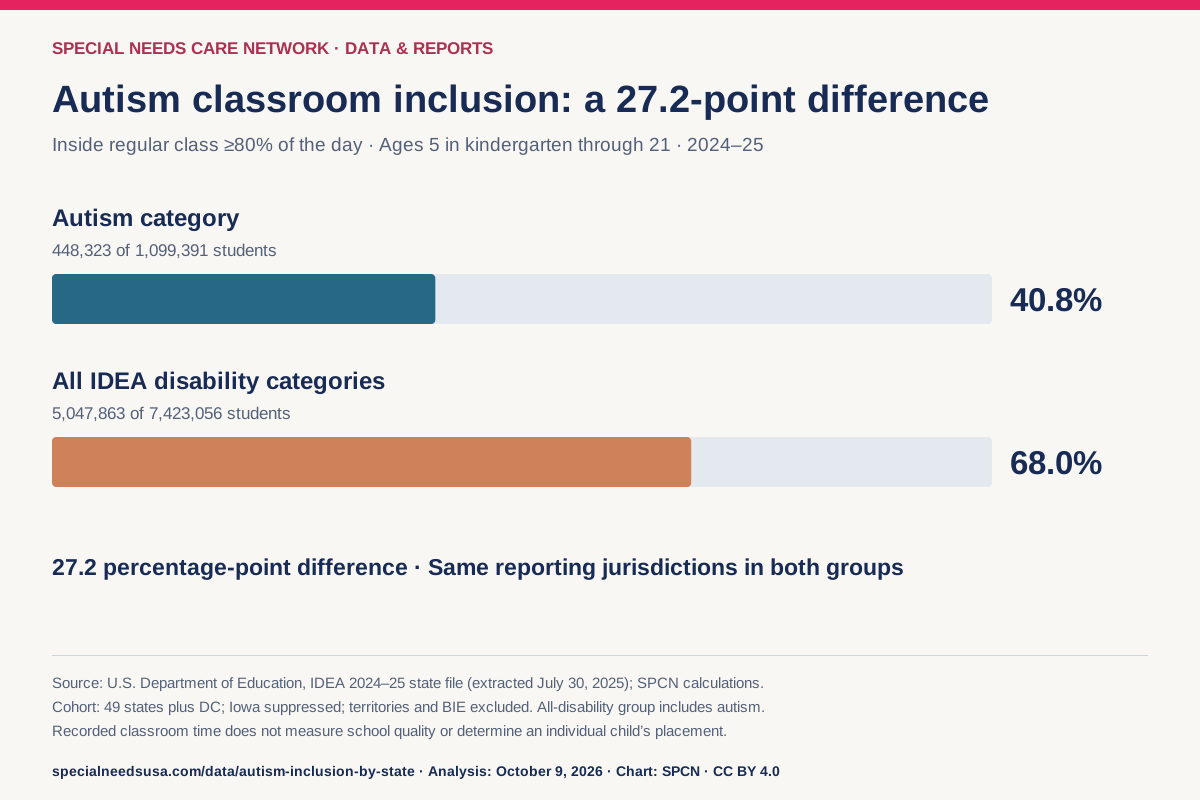
Across all IDEA disability categories in the same jurisdictions, the share was 68.0%, a 27.2 percentage-point difference.
Calculated from 448,323 of 1,099,391 autism-category students in 50 reporting jurisdictions. Iowa is excluded from both aggregate cohorts. Definitions and calculation →
What this measures: recorded classroom time, not the quality of inclusion, the adequacy of supports, or the right placement for an individual child. “Autism” here is an IDEA reporting category, not a count of everyone with a clinical diagnosis.
01 · The comparison
A 27.2-point difference in regular-class time
The autism category’s share is lower than the share across all IDEA disability categories. Both calculations use the same school year, age definition, classroom-time threshold, and reporting jurisdictions. The all-disability group includes the autism category; it is not a comparison with students without disabilities.
Students inside regular classes for at least 80% of the day
Percentage of students served under IDEA · 2024–25 · 50 matched reporting jurisdictions
Source: SPCN calculations from U.S. Department of Education, IDEA 2024–25 state data. Counts extracted July 30, 2025. Iowa excluded; territories and Bureau of Indian Education excluded. Percentages are ratios of summed counts.
Download this chart · PNG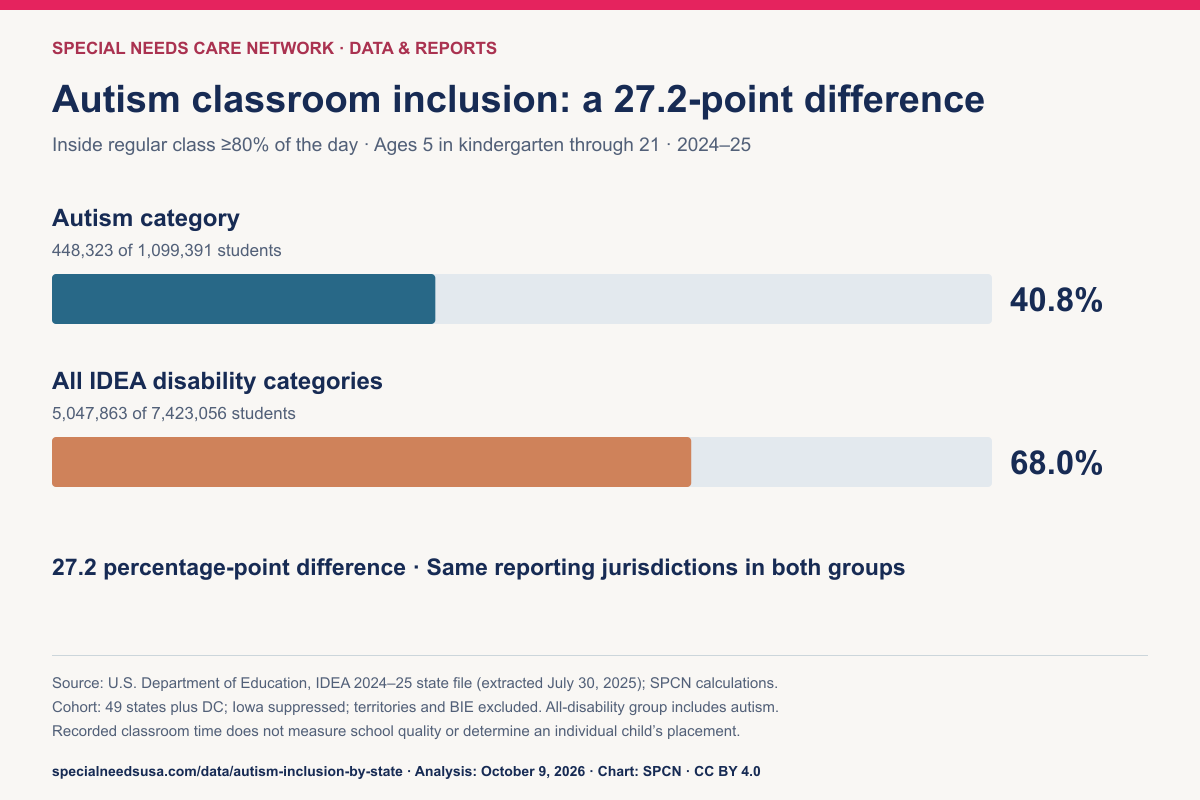
Classroom-time data describe placement patterns. They do not show whether a child had a trained aide, accessible lessons, communication support, friendships, or meaningful participation. Our guide to understanding an IEP explains the separate questions families can ask about services and supports.
02 · State explorer
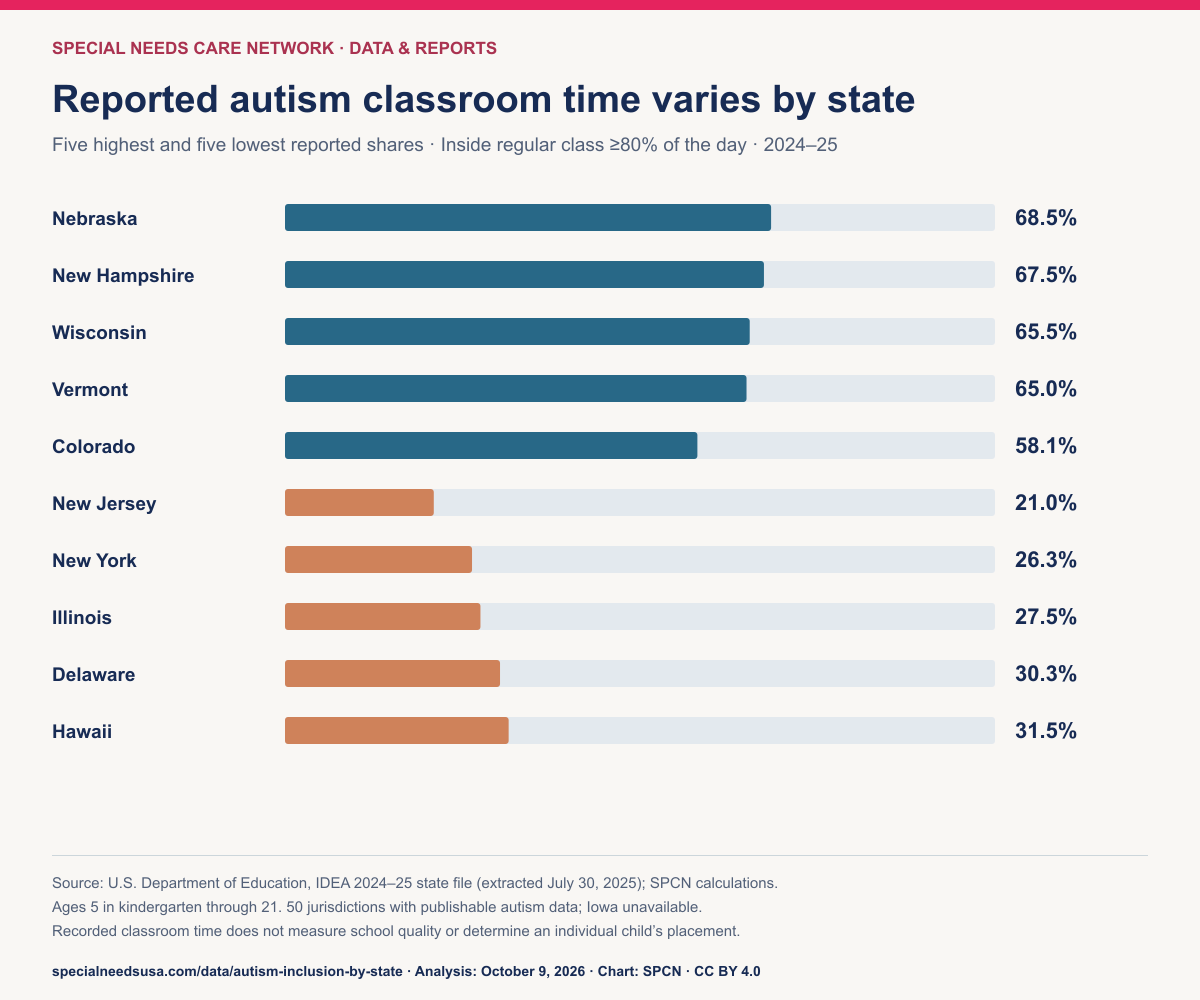
Reported shares range from 21.0% to 68.5%
Nebraska reported the highest share and New Jersey the lowest. The difference was 47.5 percentage points. These are descriptive comparisons of reported populations, not a ranking of school quality or the best states for a family to move to.
Autism-category students inside regular class 80% or more of the day
Select a state to see its counts and comparison. All 50 states and DC are listed below.
Source: IDEA 2024–25. State percentages use each state’s own autism-category total. Iowa’s source cells are suppressed; N/A is not zero. Color encodes classroom time, not quality.
Your state, in context
Choose a state above, on the map, or in the table. Each percentage is accompanied by its numerator and denominator.
Showing all 51 jurisdictions. N/A appears last when sorting by a numeric measure.
| State | Autism ≥80% | Autism count ≥80% | Autism total | All IDEA ≥80% | Difference (pp) |
|---|---|---|---|---|---|
| Nebraska | 68.5% | 4,418 | 6,453 | 82.0% | 13.5 |
| New Hampshire | 67.5% | 2,477 | 3,672 | 82.1% | 14.7 |
| Wisconsin | 65.5% | 11,165 | 17,058 | 79.6% | 14.2 |
| Vermont | 65.0% | 964 | 1,483 | 82.3% | 17.3 |
| Colorado | 58.1% | 7,308 | 12,582 | 80.9% | 22.8 |
| Alabama | 55.8% | 7,337 | 13,137 | 82.2% | 26.4 |
| Wyoming | 54.6% | 678 | 1,241 | 80.1% | 25.5 |
| Oregon | 54.4% | 7,812 | 14,350 | 77.7% | 23.3 |
| South Dakota | 54.1% | 1,224 | 2,263 | 77.2% | 23.2 |
| Oklahoma | 53.5% | 6,068 | 11,335 | 74.5% | 21.0 |
| Indiana | 52.4% | 11,046 | 21,089 | 77.6% | 25.3 |
| Tennessee | 50.9% | 9,614 | 18,883 | 76.5% | 25.6 |
| North Dakota | 49.3% | 1,004 | 2,036 | 73.4% | 24.1 |
| Texas | 48.4% | 62,921 | 130,129 | 75.6% | 27.3 |
| Mississippi | 47.8% | 3,500 | 7,320 | 78.9% | 31.1 |
| Arkansas | 47.6% | 3,944 | 8,284 | 74.7% | 27.1 |
| Idaho | 46.3% | 2,273 | 4,910 | 67.2% | 20.9 |
| Alaska | 46.1% | 965 | 2,092 | 71.5% | 25.4 |
| Kentucky | 46.0% | 5,749 | 12,509 | 76.8% | 30.8 |
| Maryland | 45.9% | 8,820 | 19,226 | 73.0% | 27.1 |
| Utah | 45.5% | 4,193 | 9,213 | 75.1% | 29.5 |
| Michigan | 45.3% | 11,946 | 26,343 | 73.9% | 28.5 |
| Minnesota | 44.7% | 12,064 | 27,010 | 63.0% | 18.4 |
| Connecticut | 44.4% | 6,325 | 14,235 | 67.2% | 22.8 |
| Rhode Island | 44.1% | 1,314 | 2,980 | 72.9% | 28.8 |
| Kansas | 43.5% | 2,759 | 6,340 | 72.8% | 29.3 |
| Virginia | 43.2% | 13,599 | 31,476 | 70.8% | 27.6 |
| Washington | 42.4% | 9,540 | 22,505 | 66.2% | 23.8 |
| North Carolina | 42.3% | 13,434 | 31,748 | 71.2% | 28.9 |
| Florida | 41.8% | 26,153 | 62,546 | 78.3% | 36.5 |
| Montana | 41.7% | 549 | 1,315 | 60.4% | 18.7 |
| Massachusetts | 41.5% | 12,508 | 30,111 | 67.4% | 25.9 |
| Arizona | 41.1% | 5,725 | 13,926 | 69.8% | 28.7 |
| Maine | 37.9% | 1,854 | 4,888 | 57.4% | 19.5 |
| California | 37.2% | 60,735 | 163,253 | 63.9% | 26.7 |
| Pennsylvania | 36.9% | 19,472 | 52,717 | 61.7% | 24.8 |
| Ohio | 36.9% | 14,038 | 38,045 | 66.4% | 29.5 |
| District of Columbia | 36.5% | 878 | 2,408 | 63.4% | 27.0 |
| South Carolina | 36.4% | 5,190 | 14,260 | 64.8% | 28.4 |
| New Mexico | 34.8% | 2,185 | 6,272 | 55.0% | 20.1 |
| Georgia | 34.3% | 11,758 | 34,231 | 60.8% | 26.5 |
| Louisiana | 34.0% | 2,896 | 8,513 | 68.3% | 34.3 |
| West Virginia | 33.0% | 1,399 | 4,242 | 62.1% | 29.1 |
| Nevada | 32.8% | 4,009 | 12,240 | 59.6% | 26.9 |
| Missouri | 32.4% | 5,901 | 18,225 | 56.0% | 23.6 |
| Hawaii | 31.5% | 842 | 2,673 | 54.2% | 22.7 |
| Delaware | 30.3% | 1,196 | 3,949 | 64.6% | 34.4 |
| Illinois | 27.5% | 10,290 | 37,380 | 53.7% | 26.1 |
| New York | 26.3% | 19,605 | 74,423 | 58.2% | 31.8 |
| New Jersey | 21.0% | 6,679 | 31,872 | 45.1% | 24.2 |
| Iowa | N/A | N/A | N/A | 76.9% | N/A |
Difference = all-disability share minus autism-category share, in percentage points. Iowa’s all-disability figure is shown for context; its autism comparison cannot be calculated. All underlying counts and environment categories are included in the CSV and JSON.
A state’s identification practices and the needs of its reported students affect the comparison. Our autism identification report covers a different question: how many children schools identify under that category. It should not be treated as the denominator for this page.
03 · Educational environments
The remaining students are spread across several settings
Spending less than 80% of the day in a regular class does not necessarily mean attending a separate school. The federal file distinguishes three classroom-time bands and several other environments.
How reported autism-category placements are distributed
Same 50 jurisdictions · 1,099,391 students · 2024–25
Source: IDEA 2024–25 state counts, SPCN aggregation. “Other” combines separate schools, residential facilities, homebound/hospital, correctional facilities, and parentally placed private schools. Rounded percentages may not total exactly 100%.
Download this chart · PNG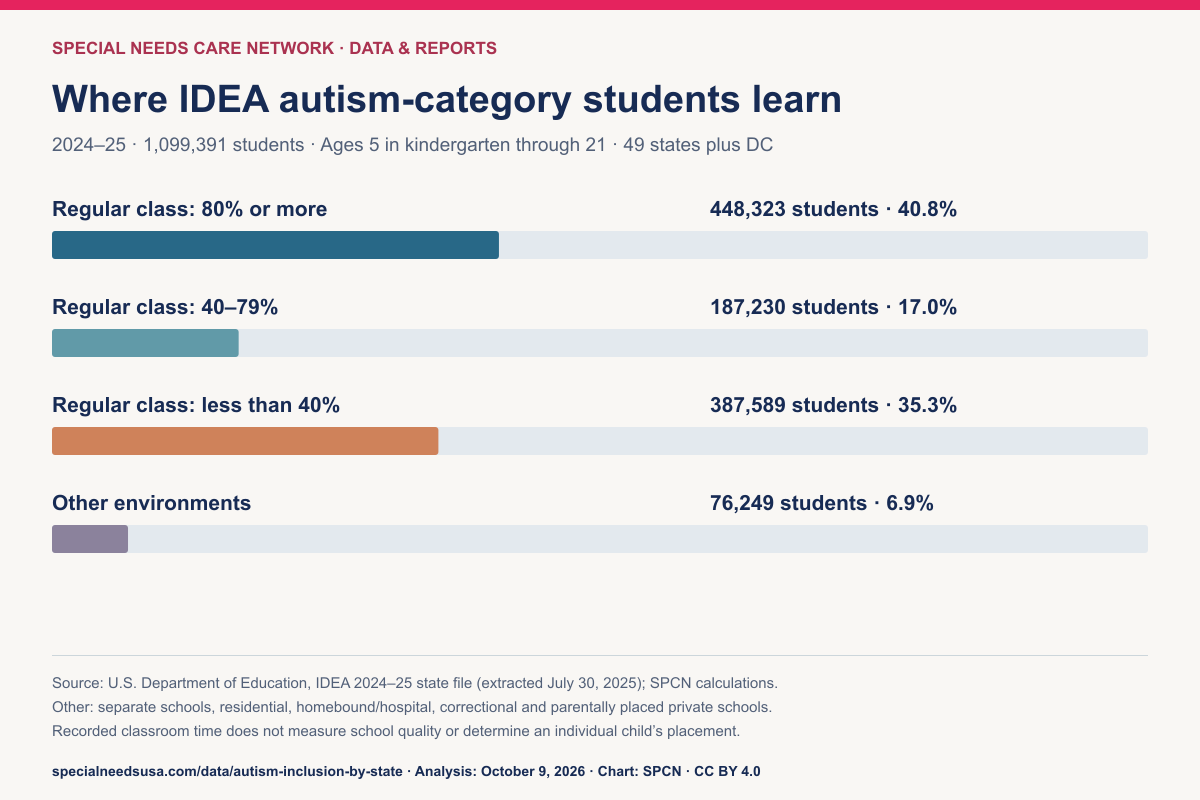
| Environment | Autism-category students | Share of total |
|---|---|---|
| Separate school | 59,377 | 5.4% |
| Parentally placed private school | 11,707 | 1.1% |
| Homebound / hospital | 3,039 | 0.3% |
| Residential facility | 2,032 | 0.2% |
| Correctional facility | 94 | 0.0% |
Source for every row: IDEA 2024–25; denominator 1,099,391. Parentally placed private-school counts are children reported through IDEA, not all autistic children attending private schools.
A separate-school placement count is also different from the number of schools available. The private special-education school report measures institutions using NCES data. Those two datasets have different populations and cannot be combined into an availability rate.
04 · Reading the figures
Classroom time is one part of inclusion
The 80% threshold is a federal reporting band. It is not a test of successful inclusion. A student may spend most of the day in a regular class while still needing substantial changes to teaching, communication, sensory access, or peer support. A lower recorded share does not establish that the placement was inappropriate.
The GAO’s July 2026 placement report found that state and district trends varied and identified resources, parental involvement, and school environment as factors officials associated with placement. This page describes the newer autism-specific counts; it does not establish what caused any state’s result.
For national context, the CDC’s Autism and Developmental Disabilities Monitoring Network estimates that about 1 in 31 eight-year-olds (3.2%) in its 16 monitored communities were identified with autism, based on 2022 surveillance data. That is a community prevalence estimate, not a count of students served under IDEA, so it cannot be compared directly with the shares above. Source: CDC autism data and research.
What these data can answer
How states reported classroom-time categories for school-age students served under IDEA’s autism eligibility category, and how those shares compare with all IDEA disability categories in the same state.
What these data cannot answer
Whether a particular child should change placement, which school provides better instruction, whether an IEP was followed, or whether a family will find an available place.
For a family comparing programs, ask how the proposed setting will deliver the child’s IEP, what supports exist during regular-class time, and how the team will monitor participation and progress. The school comparison guide can help structure that conversation; the IEP and 504 overview explains why the reporting populations differ.
05 · Methods & limitations
Built from the federal file, with the calculation exposed
Source and freshness. We downloaded the U.S. Department of Education’s IDEA Section 618 State Part B Child Count and Educational Environments CSV on October 9, 2026. The latest collection listed on the source portal was 2024–25. The file labels the count year as 2024 and gives an extraction date of July 30, 2025. A 2026 page update does not make these 2026 observations.
Population. We use the column “Age 5 (School Age)-21,” covering ages 5 in kindergarten through 21, with disability category “Autism.” Preschool rows are excluded. Children receiving services under another eligibility category, Section 504 alone, or no IDEA services are outside the autism denominator even if they have an autism diagnosis.
Classroom-time definition. Federal documentation uses the full school day, including lunch, recess, and study periods. Certain inclusive community settings and time outside class for services unrelated to a disability can also count as regular-class time. The measure is therefore broader than time spent receiving academic instruction in a classroom. Source: collection documentation, section 5.
Geography. The table contains all 50 states and DC. The aggregate uses 49 states plus DC with publishable autism counts. Iowa’s autism cells are marked “*,” which the file defines as suppression for data-quality concerns. We neither substitute zero nor infer counts. New Mexico has numeric autism counts in this release and is included. Territories, freely associated states, and the Bureau of Indian Education are excluded.
A matched comparison. For the aggregate all-disability benchmark, we use exactly the same jurisdictions as for autism. Each aggregate is the sum of the relevant classroom counts divided by the sum of the category totals. It is not an average of state percentages. The all-disability comparator includes autism. State comparisons use that state’s own all-disability denominator.
Validation. The extraction checks for duplicate records, confirms the year, verifies that counts are nonnegative and do not exceed totals, and checks that the school-age environments sum to the reported total where every cell is numeric. Missing and suppressed values stay missing in the downloadable data. Displayed percentages are rounded to one decimal; the CSV retains four decimal places.
Interpretive limits. The file contains reported administrative placements, not an observational assessment of instruction. State definitions, identification practices, age mix, student needs, and reporting quality can differ. No adjustment for these factors is made. The report cannot attribute differences to policy, funding, staffing, or school effectiveness. A higher share is not presented as a better outcome.
Update policy. Check this analysis when OSEP releases the next state file or revises the current one. Recalculate from the raw counts, review the data notes, and update all charts and downloads together. The JSON download records the source URL, collection year, access date, and raw-file SHA-256 for reproduction; the CSV contains state counts, rates, collection year, and source URL.
Questions readers ask
What percentage of autistic students are in mainstream classrooms?
In this IDEA extract, 40.8% of autism-category students in the reporting jurisdictions spent at least 80% of the day inside regular classes. That is 448,323 of 1,099,391 students. It does not mean all of them were in regular classes all day, and it is not a rate for every autistic child in the United States. Source: IDEA 2024–25.
Which state reports the highest share?
Nebraska, at 68.5%, based on 4,418 of 6,453 reported school-age autism-category students. New Jersey reported 21.0%. These measures describe classroom time; they do not determine which state or school is best for a particular child. Source: IDEA 2024–25.
Why is Iowa unavailable?
The federal file marks Iowa’s autism-category cells with “*,” its data-quality suppression marker. We leave Iowa’s autism count, share, and comparison blank rather than treat suppression as zero. Iowa’s all-disability share remains visible in the state table, but Iowa is excluded from both aggregate cohorts. Source: IDEA 2024–25.
Does the report include private schools and homeschooled children?
It includes children reported as receiving IDEA services, including the parentally placed private-school environment. Federal documentation says homeschooled children receiving publicly provided IDEA services may appear in that category. The row is not a census of private-school or homeschooled autistic children. The denominator is students reported as served under IDEA’s autism category. Source: IDEA state file and documentation.
06 · For writers, researchers & advocates
Cite it. Download it. Put the chart in your story.
The SPCN analysis and original charts are available under CC BY 4.0. Credit Special Needs Care Network, link to this report, and retain the data year, population, source, and limitations. The underlying federal dataset is separately listed as CC0.
For a local story, cite the state’s counts as well as its percentage. Describe it as a share of IDEA autism-category students in the 2024–25 release. Avoid “best state,” “full inclusion,” and “all autistic children.”
Looking for autism support in your state?
Tell us what your child needs. Special Needs Care Network matches families with vetted schools and therapy providers, free.
Find providers near youRelated resources
Connect classroom data to school and IEP planning
Keep moving through the autism data cluster, IEP planning, and school-support guides that help families act on the statistics.
Autism rates by state
All 50 states ranked by school autism identification rate and provider access.
DataAutism employment statistics
A sourced breakdown of the 85% unemployment claim and real employment outcomes.
DataRestraint and seclusion by state
Federal civil-rights data on restraint and seclusion for students with disabilities.
GuideComplete IEP guide
Use the data alongside parent rights, evaluation, and IEP process guidance.
GuideChoosing a special needs school
Translate statistics into school-visit questions and placement decisions.
Guide504 plan vs IEP
Understand which school support document fits your child and why it matters.
Sources & evidence
- U.S. Department of Education, OSEP. IDEA Section 618 State Part B Child Count and Educational Environments. Collection 2024–25; extracted July 30, 2025; accessed October 9, 2026. Direct source CSV · Collection documentation (DOCX) · State data notes (XLSX).
- U.S. Government Accountability Office. Special Education: More Students with Disabilities Were Educated in General Education Settings, but State Trends Varied Widely. GAO-26-107814, July 2, 2026. Used for interpretive context, not for this report’s state calculations.
Original analysis and chart design: Special Needs Care Network. No provider-level records or family inquiry data were used.